Power BI allows you to join data from separate datasets to develop your dashboards. This elevates the work of combining the data in Excel using LOOKUP functions, as it can be done within Power BI itself with a few clicks. If you are unsure of how you can use relationships to join multiple datasets to be presented into one Dashboard, you can check out this post I’ve created here, which dives deep into the relationship feature in Power BI.
Even though Power BI allows us to join multiple datasets together with a common column, it currently does not offer the ability to join datasets together with multiple common columns. This might be an issue for users, as it is very common for datasets to have keys derived with multiple columns. However, there is a simple workaround in Power BI that still allows you to map your datasets together with multiple columns. Today, we will be explaining how we do so.
The Problem
In the example below, we will be using a self-curated dataset that will have 2 tables, Product Forecast Data and product Actuals Data. You can get the data here in Google Sheets.

Right: Product Actuals Volume Data
In each table, they have the respective columns:
Product Forecast Volume Data:
- Date
- Product_ID (for this example, all of the items in the dataset have the same product_id)
- forecastVolume
Product Actual Volume Data:
- Date
- Product_ID (for this example, all of the items in the dataset have the same product_id)
- actualVolume
Because Product_ID has duplicates in both datasets, creating a relationship with just Product_ID will cause every line item in both datasets to be associated with one another. This will unfortunately cause inaccurate data insights, as shown below.

The Solution
The solution to this is very simple, and it is to break down the dataset further into a more granular level. As both datasets have a date tagged to the product, we can use a custom key that consists of both Date & Product_ID to create a relationship between the two datasets. Let’s run through how we do that.
Step-by-step guide
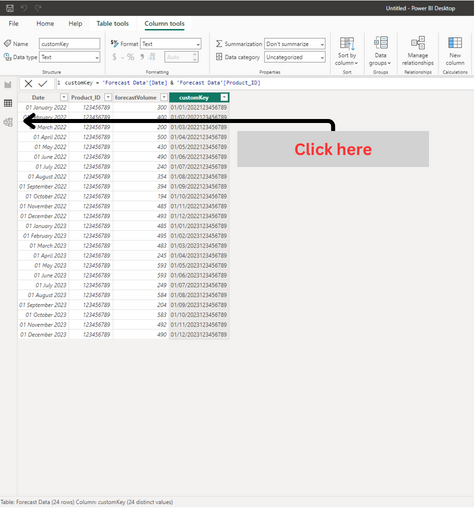
Step #1: In each dataset, create a new column that combines the columns that will be used as key
To join multiple columns together, you can use the following DAX formula:
columnName = Table[columnName1] & Table[columnName2] & … & Table[columnNameX]

Step #2: Navigate to the Relationships Model tab in Power BI
Step #3: Look for the created column in Step #1, and join the two datasets with the curated column
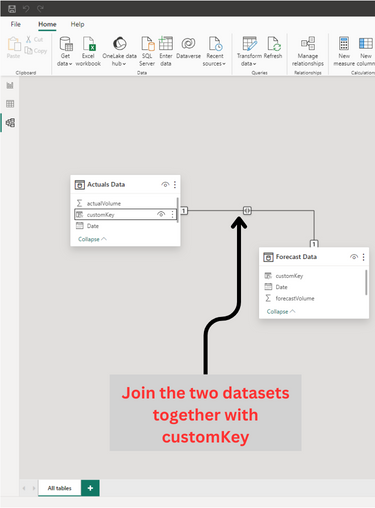
Step #4: Your dataset will be joined based on your defined key

Closing Thoughts
Power BI is an amazing tool to explain data with visualization. However, there are still certain features that are vital for an effective dashboard that is still not available. One good example would be mapping datasets with multiple columns. The workaround that I’ve provided allows you to join datasets together using multiple columns, which will definitely be useful someday as you develop more dashboards.